Profiling down to the register, then an extension that broke my assumptions twice
Nsight Compute explains exactly why the kernel loses despite moving half the memory traffic — a register count, not a guess. Then a KV-cache extension delivers a real 2x win and one result I didn't expect at all.
TL;DR: the kernel moves almost exactly half the HBM traffic naive does (1.01GB vs 2.10GB, measured, not estimated) and both implementations sit deep in the memory-bound region of the roofline — so far below the compute ceiling that raw arithmetic was never the constraint. But the Triton kernel is still slower in wall-clock time, and Nsight Compute explains why with a specific number: occupancy is capped at 25%, not failing to reach some higher figure — it's sitting exactly at its ceiling, set by register usage. I tested the obvious fix (cap registers, force more concurrent work) and it didn't help — a genuinely useful negative result. Then I extended the same memory-bound story into autoregressive decode with a KV-cache, added an int8 variant, and got a result that inverted my expectation entirely: the compressed cache uses more peak memory, not less.
Phase 3: the differentiator
The brief I was working from calls this phase "the differentiator," and it's right — anyone can claim a kernel is memory-bound; the profiler is what makes it provable.
The roofline, with measured bytes. Nsight Compute on both implementations at batch=2, heads=8, seq_len=2048, head_dim=64, fp16. Naive decomposes into six kernels — two GEMMs with different cuBLAS tile configs for QKᵀ vs P@V, a softmax, a scale, and cast kernels — moving 2.098GB of HBM traffic for one full call. The fused Triton kernel moves 1.013GB — essentially half, which is the O(N) vs O(N²) claim confirmed with real measured bytes instead of just theory.
Arithmetic intensity (FLOPs per byte moved) is 8.19 for naive and 16.96 for Triton — roughly 2x, consistent with moving half the bytes at the same FLOP count. The GPU's ridge point — where the memory-bound ramp crosses the compute-bound ceiling — sits at 65 TFLOP/s ÷ 300 GB/s ≈ 217 FLOPs/byte. Both implementations sit 13–26x to the left of that. At their respective arithmetic intensities, the best possible performance either one could hit is capped by bandwidth (2.46 TFLOP/s for naive, 5.09 TFLOP/s for Triton) — both far under the 65 TFLOP/s compute ceiling. Attention is memory-bound on this hardware no matter which kernel runs it. Moving fewer bytes is the correct lever, and it's exactly what the fused kernel does.
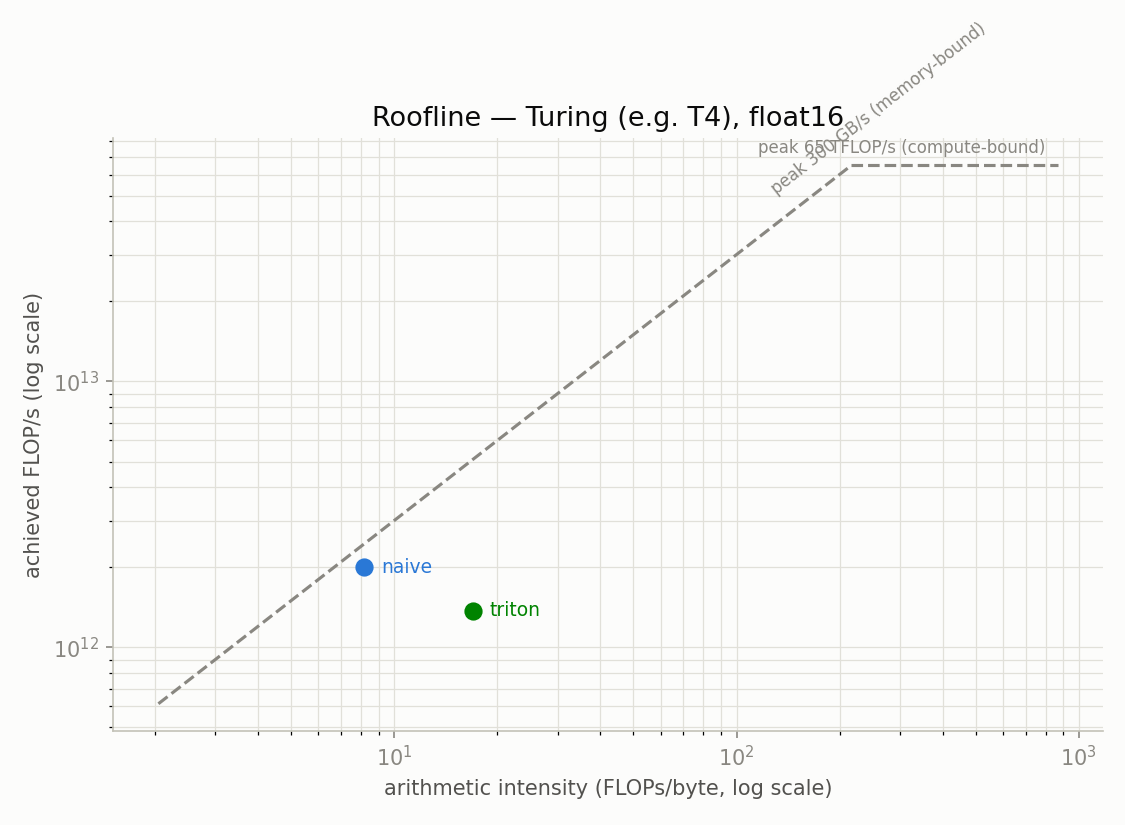
Neither point even reaches the dashed ramp line at its own arithmetic intensity — both sit visibly below the best case their own AI allows, Triton more so than naive despite Triton's higher AI. That gap between "memory-bound in theory" and "not even hitting the memory-bound ceiling in practice" is exactly what the occupancy numbers below explain.
So why is it still slower, if it's moving half the bytes? This is the question the latency numbers alone couldn't answer. A heavier profiling pass (--set full, 105 kernel launches × 31 replay passes) gives a direct, measured answer instead of a guess:
- Occupancy is capped at 25% — at its ceiling, not failing to reach a higher one. The winning kernel configuration uses 213 registers per thread and 16.38KB of shared memory per block. Both independently cap the GPU at 2 concurrent thread-blocks per streaming multiprocessor — the register math works out to exactly 2 with no rounding to spare. Nsight's own occupancy section states this directly rather than requiring inference:
Block Limit Registers = 2,Block Limit Shared Mem = 2, tied. Measured achieved occupancy: 24.7%, essentially exactly at the theoretical cap. - This is why both memory throughput and compute throughput read low at the same time in the lighter profiling pass — not two separate problems, one problem (too few resident warps) showing up as two symptoms, since there isn't enough concurrent work on the chip to hide either memory latency or compute latency.
- The dominant stall reason is pressure on the shared-memory pipeline — about 53% of stall cycles are warps waiting for that pipeline to free up. Nsight's own analysis estimates up to a 51% speedup if this specific stall were eliminated.
The full chain: small tile size → high register usage per thread → only 2 concurrent blocks fit per core → 25% occupancy ceiling → not enough parallel work to hide latency → both utilization numbers stay low → despite moving half the bytes naive does, wall-clock time still loses.
I tested my own theory directly, and it didn't hold up. If registers are really the ceiling, capping them should let more blocks run concurrently and close the gap. I added three tile configurations with a hard register cap and let the autotuner search over them. Result: no meaningful change at the profiled shape — differences were inside normal run-to-run noise — and slightly worse at the largest sequence length tested. The reason: register-limited occupancy and shared-memory-pipeline pressure are different bottlenecks that happened to produce a similar-looking symptom. More resident warps competing for the same limited pipeline doesn't relieve pressure on that pipeline — it can make it marginally worse. The real fix is restructuring the kernel's inner loop to do fewer, wider memory loads, which Nsight suggests directly — genuine kernel engineering, not a config change, and I left it out of scope rather than rush it. I kept the failed configs in the code as a documented negative result instead of quietly deleting the evidence that an idea didn't work.
Phase 4: KV-cache decode, and an extension that broke my assumptions twice
A single forward pass is one thing; autoregressive decode — generating one token at a time, re-reading the whole growing KV-cache at every step — is where memory-bandwidth cost actually shows up in real LLM serving. I built a manual decode loop over GPT-2-small, then an int8 KV-cache variant on top of it.
The debugging saga, because the lesson generalizes past this project. The first real run hit a CUDA device-side assert. I chased it in order through fp16 numerical overflow (switched to bf16 — didn't fix it), a fused-vs-unfused GEMM code path (didn't fix it), a possibly corrupted CUDA context (full instance restart — didn't fix it), and a degenerate batch-size-1 GEMM shape (batched up to 4 — changed the symptom, not the outcome). Every one of those was a reasonable hypothesis given the evidence in front of me at the time. Every one was wrong, because CUDA reports device-side assert errors asynchronously — the real failure kept getting misattributed to whatever unrelated kernel happened to be checked next. Setting CUDA_LAUNCH_BLOCKING=1, which PyTorch's own error message had been suggesting from the very first crash, finally forced synchronous reporting and revealed the actual bug: a context-length sweep was asking GPT-2 to decode past its hard 1024-position limit — architecturally impossible, and unrelated to every hypothesis I'd spent the most time on. Lesson for next time a device-side assert shows up: reach for CUDA_LAUNCH_BLOCKING=1 first, before forming any hypothesis about the cause.
Context-length sweep, batch=4, bf16:
| prompt_len | median step (ms) | tokens/s | peak mem (GB) |
|---|---|---|---|
| 32 | 11.765 | 85.0 | 0.263 |
| 128 | 12.022 | 83.2 | 0.324 |
| 512 | 12.347 | 81.0 | 0.546 |
| 1000 | 13.728 | 72.8 | 0.945 |
Per-token latency rises with context, the right direction for a bandwidth-bound claim — but achieved latency is still roughly 27x the theoretical bandwidth floor even at the longest context tested. The bandwidth cost is real and growing fast (the theoretical floor grows 20x across the sweep while achieved latency only grows 17%), but at GPT-2-small's scale it doesn't dominate outright yet — fixed per-step overhead is still the bigger term. Claiming "decode is memory-bound, full stop" here would overclaim what a 124M-parameter model actually shows.
int8 KV-cache — two clean wins and one result I didn't see coming. Cache size exactly halved (78.3MB → 39.1MB, measured, not theoretical). Output quality: 100% token match against baseline greedy decode, identical generated text. Speed: a wash, consistent with the overhead-bound finding above rather than a separate mystery.
Peak memory went up — 0.527GB → 0.780GB. My int8 decode loop dequantizes the entire cache back to bf16 every single step, because nothing in GPT-2's attention code was written to consume int8 tensors directly. So at the busiest point of each step, memory holds the compact int8 cache and a full bf16 working copy at the same time — more total memory in flight than the baseline's single bf16 copy ever needed. It's the same thing as unzipping a file to use it: the zipped and unzipped copies both take up space while you're actually using it. Better hardware doesn't fix this either — this GPU already has native int8 tensor cores (that arrived with the Turing generation, not Ampere; the actual Ampere-only gap is bf16 support). The real fix is an int8-aware attention kernel that dequantizes tile-by-tile inside the kernel — the same materialization discipline the Phase 3 kernel already applies to the score matrix, just not yet applied here. Left out of scope for the same reason as the register-pressure fix: it's real kernel engineering, not a quick patch.
Project status
| Phase | Result |
|---|---|
| 0 — Env + kernel scaffold | Done |
| 1 — Correctness | 96/96 across shape/dtype/causal grid; causal error floor traced to a degenerate single-key softmax |
| 2 — Benchmarks | Memory footprint matches SDPA; latency loses to naive at every shape, gap widening with N |
| 3 — Profiling | Root cause found: 25% occupancy ceiling from register pressure, ~53% of stalls on shared-memory pipeline pressure; register-cap fix tested and correctly rejected |
| 4 — KV-cache + int8 | Cache size exactly halved, zero quality loss, peak memory increased — a real, understood, and honestly reported limitation |
What's still open
The register-pressure ceiling and the int8 cache's peak-memory regression are both unresolved, on purpose — both need an actual kernel rewrite (fewer/wider memory loads; tile-by-tile int8 dequantization inside the kernel), not a configuration change, and I scoped them out deliberately rather than rushing something half-finished. And to be direct about the one comparison that matters most: this does not beat SDPA, anywhere, at any shape tested — it's 1.5–3x slower across the whole sweep. That gap, and the profiler evidence for exactly where it comes from, is the actual deliverable. Not a number to be embarrassed about.
Full code, raw logs, and the complete phase-by-phase history (including every wrong turn) are at github.com/akashg71/gpu-attention.