Getting the kernel correct, then benchmarking it honestly
96/96 correctness checks pass, then the kernel loses to naive PyTorch on every single shape tested — and why that's a result to report, not a bug to quietly fix first.
TL;DR: the Triton kernel is numerically correct — 96/96 across sequence length, head dim, batch size, causal masking, and fp16/bf16. Benchmarked against naive PyTorch and SDPA, it wins cleanly on memory (matches SDPA's flat footprint against naive's quadratic blowup) and loses on latency at every sequence length tested, by a widening margin as sequences get longer. That's a real result, not something to fix before publishing — figuring out why it loses despite moving fewer bytes is what the profiling phase is for.
Phases 1 and 2: correctness first, then benchmarks. Here's what happened, including two bugs in my own measurement code that would have made the numbers look better or worse than reality if I hadn't caught them.
Phase 1: correctness before anything else
The kernel gets checked against a plain, obviously-correct PyTorch implementation via torch.allclose, across seq_len × head_dim × batch × causal × dtype — 96 combinations in total. 96/96 pass.
The grid wasn't right the first time. Every sequence length I'd chosen was a power of 2, which divides evenly into every tile size the kernel autotunes over — meaning the boundary-masking code (the logic that handles a sequence length that doesn't fit evenly into a tile) had never actually run, despite everything passing. I added 1000 to the grid specifically because it isn't a multiple of any tile size, and re-ran. Still passed, but now the masking logic was actually exercised rather than accidentally skipped. A green test suite that never touches your edge cases isn't really testing them.
The error pattern turned out to be its own small finding. Non-causal fp16 error shrinks as sequences get longer — 0.000977 at N=128 down to 0.000244 at N=4096 — because softmax over more keys spreads probability thinner, which shrinks output magnitude, and absolute error tracks magnitude. Causal error does something different: it sits at an exact constant, 0.001953125 (2⁻⁹) for fp16 and 0.015625 (2⁻⁶) for bf16, regardless of sequence length. The reason: under causal masking, the very first query position can only attend to one key — itself. Softmax over a single value is trivially 1.0, so that row's output degenerates to copying a V value through dtype rounding — a fixed rounding step that never shrinks, and dominates the sequence-wide maximum error no matter how long the sequence gets. The 8x gap between the two floors matches the mantissa bit-count difference between the formats exactly (fp16: 10 bits, bf16: 7 bits, 2³ = 8) — good independent evidence this is a precision-rounding effect and not a bug.
Phase 2: benchmarks, and the two honest results
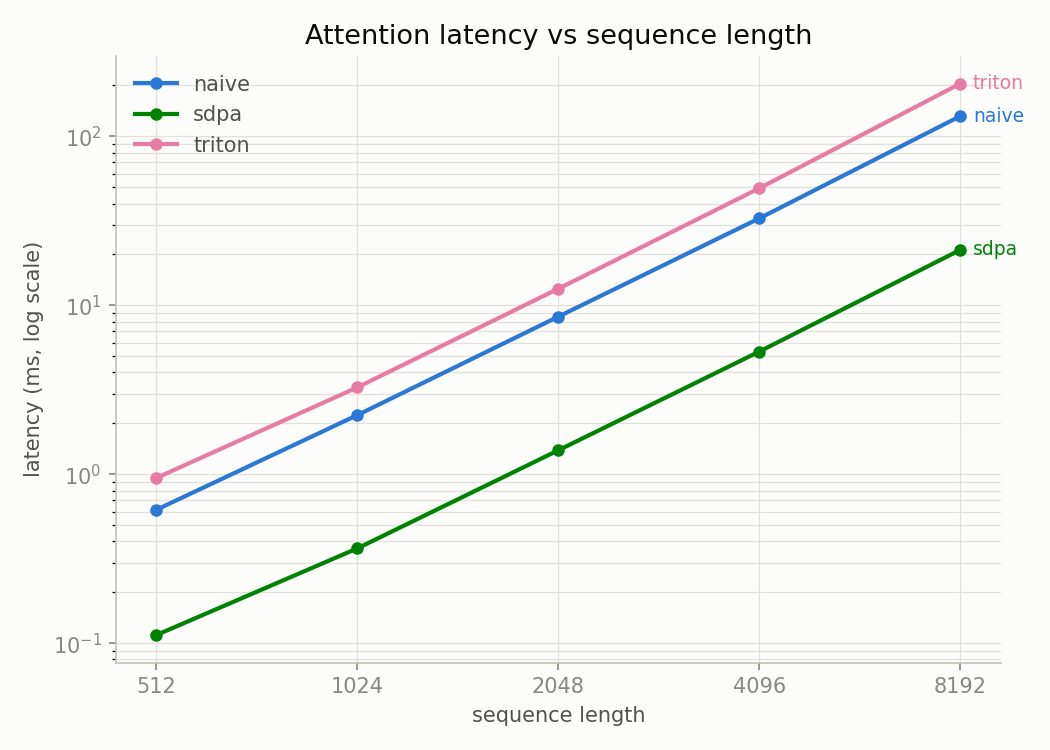
CUDA-event timing, median of 50 runs after a separate warmup pass, GPU clocks locked to cut variance, swept over sequence length from 512 to 8192:
| seq_len | impl | latency (ms) | TFLOP/s | peak mem (GB) |
|---|---|---|---|---|
| 512 | naive | 0.616 | 1.74 | 0.050 |
| 512 | sdpa | 0.112 | 9.61 | 0.012 |
| 512 | triton | 0.950 | 1.13 | 0.012 |
| 2048 | naive | 8.565 | 2.01 | 0.645 |
| 2048 | sdpa | 1.386 | 12.40 | 0.024 |
| 2048 | triton | 12.528 | 1.37 | 0.024 |
| 8192 | naive | 131.724 | 2.09 | 10.055 |
| 8192 | sdpa | 21.284 | 12.91 | 0.070 |
| 8192 | triton | 205.150 | 1.34 | 0.070 |
Two results, not one:
Latency is not a win. The kernel loses to naive at every sequence length tested, and the gap widens with N — the opposite of what "moves fewer bytes" would predict on its own. SDPA's efficiency roughly triples across the sweep (4.2 → ~13 TFLOP/s); the Triton kernel's stays flat around 1.1–1.4 the whole time. Latency numbers alone can't say why — that needed an actual profiler, not more guessing, which is the next post.
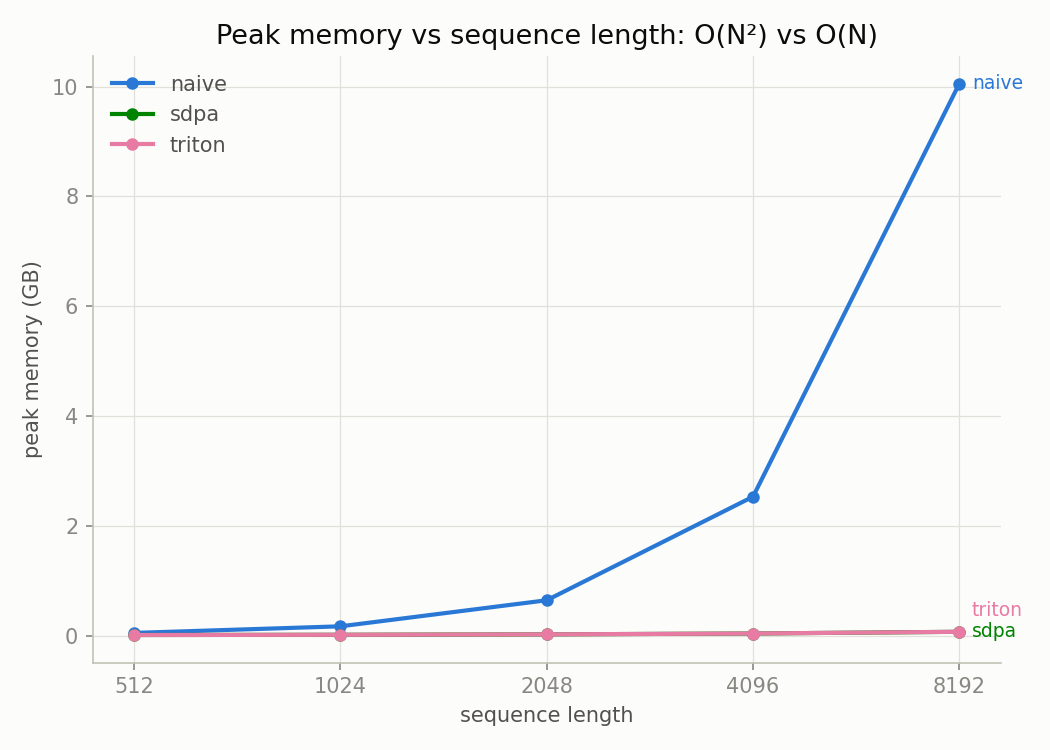
Memory is a clean win. The Triton kernel matches SDPA's near-flat footprint; naive grows quadratically (0.050GB → 10.055GB across the sweep). This is the whole thesis, visible, before any profiler gets involved.
Two bugs in my own measurement code
Peak memory contaminated by warmup. After adding autotuning to the kernel, its reported peak memory jumped from 0.016GB to 0.266GB — suddenly worse than naive, which would have undercut the entire memory story if I'd trusted it. The cause: reset_peak_memory_stats() was running before warmup, and warmup is exactly when Triton's autotuning search happens — it allocates its own scratch buffer to time each candidate kernel configuration fairly, and that one-time allocation was getting counted as if it were steady-state memory. Fix: split warmup into its own step that completes before the memory counter resets. Peak memory dropped straight back to 0.016GB, matching SDPA exactly.
An SDPA anomaly that took real investigation to close. SDPA measured 6–7.7 TFLOP/s in early isolated runs but ~12.6 TFLOP/s in the sweep, at the identical shape. My first hypothesis was a cold-start effect — but naive always runs immediately before SDPA in both code paths, so SDPA was never literally the first GPU operation either way; that hypothesis didn't survive a look at the actual code. Built a small diagnostic script to force each SDPA backend explicitly and compare isolated-vs-primed timing under each. The real cause was simpler and already half-diagnosed: unlocked GPU clocks. Three fresh, back-to-back runs with no code differences at all had already shown a 22% spread among themselves before clocks were locked — enough alone to explain a gap this size, no priming story required. Confirmed something else useful along the way, too: Flash Attention itself is hardware-incompatible with this GPU (a Tesla T4 — PyTorch's own error message says so explicitly), so SDPA here runs via the memory-efficient backend, not Flash Attention.
Next: profiling this down to the register to actually answer why the kernel loses despite moving half the memory traffic, and an extension into KV-cache decode.